One of the core challenges of process analytics from event data is to enable an analyst to get a comprehensive understanding of the process and where problems reside.
In business process mining such an overview is obtained with a process map. It can be discovered from event data to visualize the flow in the process and highlight deviations and bottlenecks.
Process maps of logistics processes do not give these insights: they are too large to comprehend, the maps do not visualize how processing of materials influences each other, and – as they show an aggregate of all event data – they fail to visualize how performance and processing varies and changes over time.
In the “Process mining in Logistics” project by Eindhoven University of Technology and Vanderlande, we therefore developed a new visual analytics technique which we call the Performance Spectrum:
- The performance spectrum maps out process dynamics for all steps and all cases over time, by adding a “time axis” to the process map.
- The performance spectrum visualizes each case and each step over time individually allowing analysis to see how materials and cases of a process are handled together and how they influence each other.
- The explicit visualization of all cases together reveals how process deviations and short- and long-term performance problems evolve over time and influence each other.
The image below shows the performance spectrum of a baggage handling system along a sequence of check-in lines over time. Bags are put into the system at point a1 and then are moved via conveyor belts to point a2. Each blue or orange line in the top-most segment a1:a2 in the performance spectrum shows the movement of one bag from point a1 to point a2 over time. The angle (and color) of the line indicates its speed.
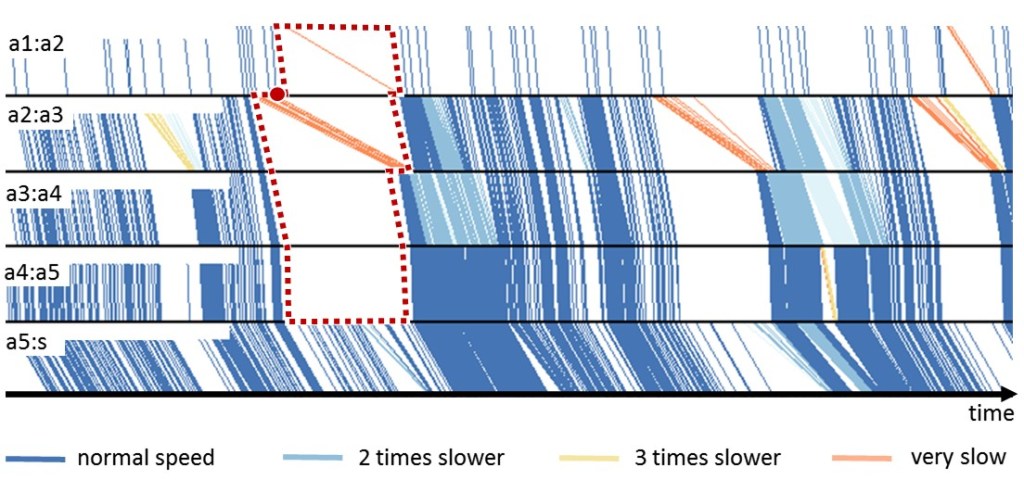
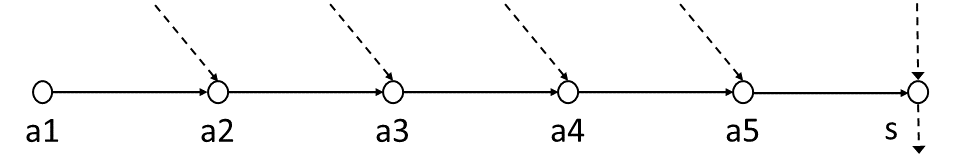
As shown on the layout schema below, further bags enter the system from another check-in point a2 and are also moved to point a2, where both flows merge on the segment a2:a3, etc. All bags eventually reach the point “s” from where the bags are routed further into the baggage handling system. In the performance spectrum, we can see the movement of a bag over these segments through the consecutive lines.
As bags cannot overtake each other on a conveyor belt, we can immediately identify in the performance spectrum several behavioural patterns:
- Normal operations, for example in the left part of the performance spectrum, show how bags flow tougher from the check-in points to point s, each segment having its own speed, and no bags are overtaking each other.
- Repeated operational problems can be seen in the segment a2:a3 (orange-slanted lines) where the conveyor belts are halted for a certain period, leading to significantly delayed processing, to no flow in segments a3:a4 and a4:a5, and to backwards queuing in segment a1:a2, while segment a5:s is unaffected as the bags coming from a5 can move freely.
- After the short-term performance problems are resolved, the system shows recovery behaviour under high-load as the system resumes to normal operations, visible by a large number of bags (many lines close together) moving two times slower than normal (light blue).
- Moreover, the repeated performance problem was already briefly visible in a2:a3 in the initial phase (showing a group of bags moving 3x slower than normal).
The visualization allows process managers and engineers to both quickly locate the cause of the problem to prevent it happening in the future. In particular the briefly-visible performance problem in a2:a3 prior to the halt of the conveyor belt can be identified as an early warning signal to detect possible performance problems in the future, and also to understand and improve system recovery behavior.
We realized this technique in a high-performance visualization tool which we call the Performance Spectrum Miner. It has proven itself reliable to:
- analyze very large amounts of event data (of over 100 million events),
- quickly identify temporary process deviations in very large processes,
- quickly locate short- and long-term performance problems as well as gradual and abrupt changes in process performance,
- identify the root-cause of performance problems and deviations in logistics processes occurring only under certain conditions.
We released a smaller-scale version of the tool (as a ProM plugin or as standalone tool) together with a manual on https://github.com/processmining-in-logistics/psm.
More information
- Research article: Vadim Denisov, Dirk Fahland, Wil M. P. van der Aalst: Unbiased, Fine-Grained Description of Processes Performance from Event Data. BPM 2018: 139-157 https://doi.org/10.1007/978-3-319-98648-7_9
- Tool demonstration: Vadim Denisov, Elena Belkina, Dirk Fahland, Wil M. P. van der Aalst: The Performance Spectrum Miner: Visual Analytics for Fine-Grained Performance Analysis of Processes. BPM (Dissertation/Demos/Industry) 2018: 96-100 http://ceur-ws.org/Vol-2196/BPM_2018_paper_20.pdf
- Case study: Vadim Denisov, Elena Belkina, and Dirk Fahland: BPIC’2018: Mining Concept Drift in Performance Spectra of Processes. Business Process Intelligence Challenge 2018. https://research.tue.nl/en/publications/bpic2018-mining-concept-drift-in-performance-spectra-of-processes

One thought on “The Performance Spectrum”