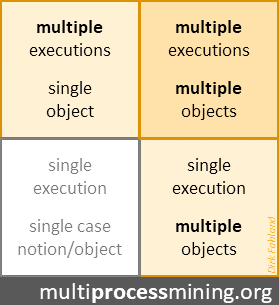
multiprocessmining.org is an initiative to gather use cases and develop technologies for process mining over
multiple objects and entities,
multiple actors,
multiple systems,
multiple levels,
…
multiprocessmining.org is an initiative to gather use cases and develop technologies for process mining over
multiple objects and entities,
multiple actors,
multiple systems,
multiple levels,
…
a use case, a dataset, a tool, a paper, a presentation, a case study, an opinion on Multi… Process Mining you want to share and highlight?
The shift to object-centric process mining is enabled by a change in the underlying data model: from cases (which flattens source data to group events by a single primary identifier) to object-centric event data (which models relations between objects and events using many-to-many relations).
This shift also comes with a storage and performance overhead – making object-centric event data larger and slower to build and to query, being one of the hurdles for adoption of object-centric process mining.
Insufficient performance has often used as argument against using graph databases such as Neo4j for storing and querying object-centric event data. A typical question I would receive 5 years ago is:
“Nice idea, but can you handle 100 million events?”
In the past, I would answer:
“Not yet, but I will and all I have to do is wait and let the database community do what they do best: improve performance over data.”
Having now waited for about 5 years, where are we? And now I can answer:
“We are getting closer. The database community delivered faster systems and it’s time for us to start working with them – the systems and the community.”
In this post, I want to show what has happened regarding performance for object-centric and multi-dimensional analysis use cases.
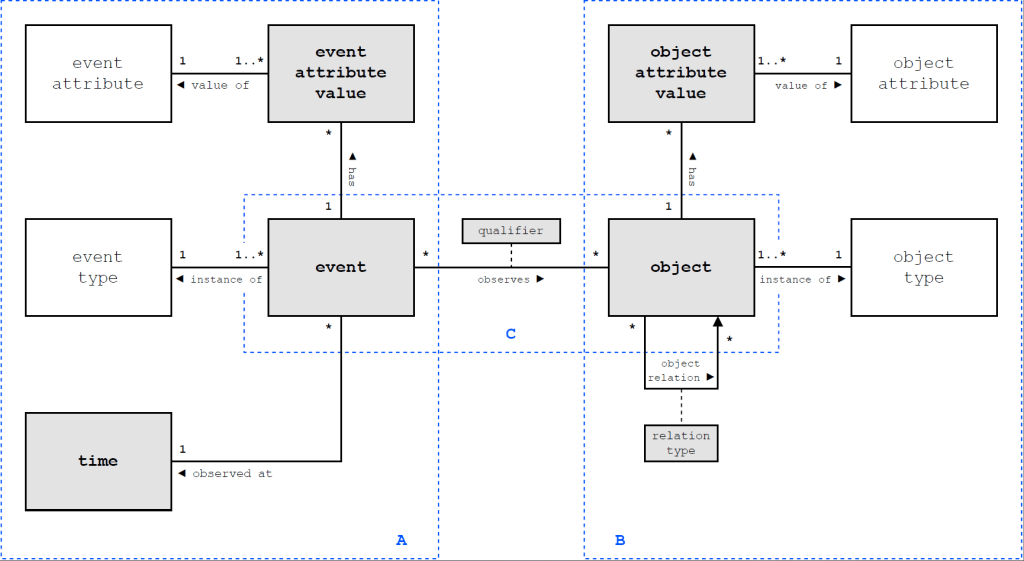
Object-centric event data is built on the following four concepts
Next to this, process mining analysis infers and operates on behavioral relations between events, specifically the directly-follows relation per object (as explained in this blog post and these tutorials)
Various implementations of object-centric event data models exist, both over relational databases and over graph databases, see this report.
One of the reasons that object-centric event data is more challenging to model and query is that it is conceptually more graph-based than relational and the existing standard data systems, relational databases and graph-databases, offer different trade-offs:
A recently published paper on Object-Centric Process Querying by Aaron Küsters and Wil van der Aalst paints the picture clearly. That task is to search for a subset of data (objects) that match a query pattern. For the moderately sized BPI Challenge 2017 event log (1.3 million events), these query patterns look for one or two related objects with two related events and some constraints over these events (involving approximately 3-4 joins in terms of a relational database).
For example, the following pattern (written in the query language Cypher) looks for all Applications where there is no related Offer that was accepted after the application was accepted.
MATCH (o1:Entity { EntityType: "Application" }) <-[:CORR]- (e1:Event {activity:"A_Accepted"})
WHERE NOT EXISTS {
    MATCH (o1) <-[:REL]- (:Entity {EntityType: "Offer"}) <-[:CORR]- (e2:Event {activity:"O_Accepted"}) WHERE e1.timestamp <= e2.timestamp
}
RETURN COUNT(o1) as violationCount
For evaluating such queries,

That paper shows also that the trade-off can be overcome by building a (dedicated) data model and nice (visual) query interface that allows to answer these queries within 50ms. In other words, the trade-off stated between relational and graph-based systems is not inherent, but we can build modeling and querying object-centric event data can be done, both, highly scalable and with simple, easy-to-understand queries.
But it requires engineering homework.
This raises the question who should do the engineering?
In the following, I will show that the database community is already doing the engineering to deliver faster performing systems. But I will also show that – to really reach desired performance levels – we need to educate the database community about our use cases.
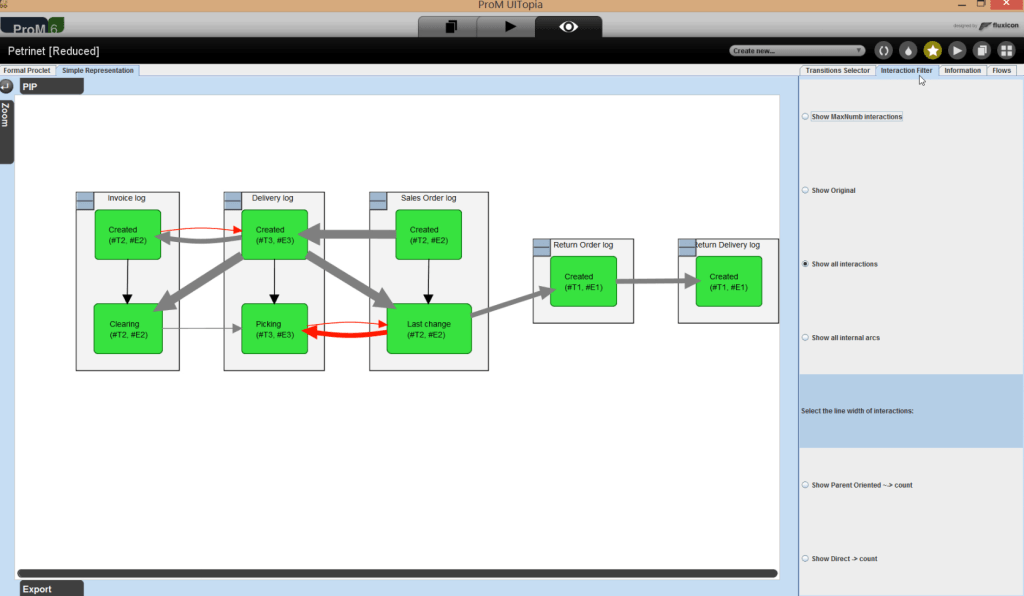
Let’s zoom out. Over the last years, we developed Event Knowledge Graphs (EKGs) as versatile data structure for object-centric and multi-dimensional event data. Since its inception, EKG’s provide the core concepts of object-centric event data and allow to materialize further analysis information – such as the directly-follows relations – for faster performance.
Event knowledge graphs are based on labeled property graphs – a data model that is supported by a range of graph database systems.
Over the last years we have used the graph database system Neo4j to develop and demonstrate the concept of EKGs for object-centric and multi-dimensional event data analysis. Neo4j is helpful as it is robust, has a very extensive implementation of the graph query language Cypher and has a fairly versatile visual and interactive query interface. This allowed us to iteratively try out and improve ideas before turning them into modules of the Python library PromG for ETL, data modeling and process mining using graphs.
But – as the experimental results on OCPQ above show – Neo4j is not the fastest data system for object-centric process mining.
However, our development approach for EKGs and their usage has been to build all data modeling and querying on open standards – the labeled property graph model and the query language Cypher (which is slowly being transformed and absorbed into a new graph query language standard).
Using open standards allows us to move ETL pipelines and analysis queries for EKGs from Neo4j to a different graph database. One such alternative is kuzu db – a very light-weight in-memory graph database.
Triggered by the above OCPQ experiments I adapted the ETL pipelines to build EKGs from CSV files we wrote for Neo4j to work for kuzu db. The biggest challenge (and also reason for performance gains) was that
While this requires some additional effort in making the data model during ETL more explicit, the actual ETL queries could be effectively reused (with one exception I will reflect on later in the post). The queries to build an EKG for BPI Challenge 2017 for kuzu db are available on this github repository: https://github.com/multi-dimensional-process-mining/graphdb-eventlogs
Doing this, we already see a performance improvement just for building the EKG.
Running the OCPQ queries on the event knowledge graph in kuzu db, we immediately get a performance improvement of factor 5x to factor 10x (as shown in the table below under KuzuDB – Generic Schema), from 723-1530ms for Neo4j to 57-261ms for kuzu db.
The development effort for this performance improvement for me was about 5-6 hours in total – and most of it was spent in looking up the kuzu db documentation. I would consider this a perfect division of work for lowering one of the hurdles for adopting object-centric process mining.

During this small engineering exercise, I stumbled over two things that significantly helped increase performance – but where I had to work “around” the capabilities of the current data systems to achieve desired or improved performance.
Both are concerned with building object-centric event data models but have a different focus:
When building the EKG for BPI Challenge 2017, I also tried to materialize the directly-follows relation using the standard query we are using with Neo4j
MATCH (n:Entity)
MATCH (n)<-[:CORR]-(e)
WITH n, e AS nodes ORDER BY e.timestamp, ID(e)
WITH n, collect(nodes) AS event_node_list
UNWIND range(0, size(event_node_list)-2) AS i
WITH n, event_node_list[i] AS e1, event_node_list[i+1] AS e2
MERGE (e1)-[df:DF {EntityType:n.EntityType, ID:n.ID}]->(e2)
It retrieves all events related to an object, collects these events (ordered by time) into a list and then iterates over the list to materialize a directly-follows edges between two subsequent events. Not very elegant in terms of graph queries, but it gets the job done and shows how process mining sees graphs somewhat differently than other domains.
Kuzu db cannot execute this query in a performant way – it simply runs out of memory within 30 seconds as it lacks a batching mechanism to break up the query workload into smaller parts (e.g. per object) that requires much less memory. In contrast, Neo4j provides such a batching mechanism.
So, to build the directly-follows relation, I had to realize a different “around” kuzu db to build the directly-follows relation in a faster way, which consists of
This process mining-“native” operation is much faster and scalable than the query above, but ideally wouldn’t require moving the data out of the database and back in. Rather, it should be an operator in the database. But the database community will only know this if they hear from us that this is an important use case.
Another performance gain comes from a different physical data model. It’s a lesson well known from relational databases, but not exploited much for graph databases.
When transferring the ETL for building and EKG to kuzu db I used the generic OCED data model concepts, specifically all objects are represented as generic :Entity nodes and their specific type is expressed through a property of the node.
We already have seen in prior studies that practical applications benefit from explicitly modeling the domain’s concepts, i.e., using :Application and :Offer nodes to model application and offer objects.
I also explored this way of modeling in the ETL for kuzu db. Physically, kuzu db creates one table per object type (with its own index). Also relations get typed in this way as a relation table now links from one typed table to another typed table.
Technically, this applies vertical partitioning of a generic table into multiple tables of a specific type. Adapting the queries to explicitly refer to the typed relations yields another performance boost (in the table above listed under Kuzu DB – Typed Schema):
Achieving this results took me
The entire ETL and OCPQ experiment on kuzu db is available here: https://github.com/multi-dimensional-process-mining/graphdb-eventlogs/tree/master/csv_to_eventgraph_kuzudb
The beauty of achieving this performance with kuzu db is that it required comparatively little effort for the performance gains achieved, while still building on a general purpose data system with a generic query language allowing to be extended with other operations and other types of queries for object-centric process mining.
Overall, I think that the strategy of letting the database community do what it does best – deliver high-performance data systems – is already paying off for process mining. As illustrated for Event Knowledge Graphs:
That also means the time for “just waiting for the other side” is over – it is time to engage with the database community at a deeper, conceptual and technical level to help them build the data systems that support object-centric process mining use cases at scale.
What exactly we need, we are still figuring out. I believe we need the capability to build various forms of process mining specific abstractions and analysis results – to be directly materialized next to the data itself, such as
Over the last months I had various exchanges with practitioners and vendors in process mining on the topic of Object-Centric Process Mining (OCPM). And while the idea has been around for a while, industrial adoption remains a challenge even for seasoned experts. But why is that?
From these conversations I gathered that adopting OCPM faces different hurdles than getting started with process mining in general.
In the following, I want to summarize and reflect on my insights from these conversations. And I hope they help the PM community – researchers, vendors, and practitioners together – to ease the transition to OCPM.
The idea of Object-Centric Process Mining (OCPM) is directly analyze the events in relation to the objects and relations we see in the data (as a network of events and objects) instead of extracting cases (as sequences of events) which distorts and transforms the data. In essence, with OCPM, analysts
The term OCPM itself has been coined in 2019 with first roots in 2017 and in 2018. Yet, the topic of modeling and analyzing processes “as-is” rather than through artificial sequences of events is almost as old as the field of process mining itself. Much development happened under the term “artifact-centric process mining” from 2010 onwards with first data models and algorithms for “events related to multiple different objects” implemented in ProM already in 2011 until 2013 in various approaches and validated in industry.
These ideas eventually evolved into OCPM by 2019.
Having researched artifact-centric and object-centric process mining myself for 15 years, the first and biggest hurdle has been to get the key idea and concepts right and simple. As simple as possible. This took multiple (slow) iterations and independent contributions – but I think we are now there. This keynote talk explains how this happened and what the simple core of OCPM is.
And as true testament to the simplicity achieved and the innovative power of the process mining industry, we saw the first commercial OCPM implementations (sometimes under different terms) already in 2021 and 2022:
The idea and principles of OCPM are now viable for industry adoption.
Despite all these tangible benefits and demonstrated viability, OCPM has not become the mainstream approach to process mining. Many vendors and practitioners are adopting OCPM much more slowly. If it’s so good, why isn’t everyone doing OCPM?
The first hurdle has been take : OCPM had simple enough concepts to allow others to adopt it(see above). So, it can’t be the complexity of the ideas or theory behind it.
And indeed, the discussions I have been having with practitioners and vendors on working with OCPM all start from the point that they do understand the concept, benefits, and potentials of OCPM. So, it’s also not about lack of explanation or education about the concept – as there are online learning resources and courses available.
What I rather gathered from my exchanges is that process mining practice has accrued a socio-technical debt. Let me explain.
Getting started with OCPM is surprisingly expensive if you already have a successful practice or product for process mining in place. Even so on the processes that we always consider as the main motivator for OCPM: Order-to-Cash, Purchase-to-Pay, Accounts Receivable, etc… – processes that manage many objects in complex relations and where event log extraction falsifies statistics and process information.
Why is that? Because 20 years of efforts spent in dealing with these processes in a case-centric manner:
The entire process mining pipeline and software stack from conceptualizing the process mining project and scoping the data to extraction, modeling, aggregation and querying and computation (generic and use-case specific), dashboarding and user-flow is a result of 20 years of well-developed conceptual and methodological thinking and countless person years of software engineering and training. As a software vendor and as a practitioner dealing with a sizable information systems and regular process mining activities, you have built up
Object-centric process mining touches this complex socio-technical construct at its very foundation and
I am not saying that our 20 years of knowledge of doing process mining is now obsolete. To the contrary, everything we learned is valuable.
However, the way how our existing case-centric process mining solutions combine and integrate this knowledge is not working for OCPM and has to be revised. In software engineering this is called technical debt. But for process mining, it’s not just software but also the processes of using it for analyses and their integration in the organizations that use it. So it’s a socio-technical debt.
Reducing technical debt is hard – especially if it is in the very systems that you rely on to generate revenue or reduce costs. We cannot simply swap out a classical case-centric solution for an object-centric one. Instead, we need migration strategies.
This is something that we have not been discussing in the process mining community so far – at least not broadly and certainly not within the academic community.
So while we are at the topic, I want to throw out some ideas and thoughts – hoping that they resonate and lead to a dialogue and fruitful collaborations and (research) projects between researchers, practitioners, and vendors.
While the “usual suspects” of standard processes such as O2C, P2P, AP etc. are strong motivators for OCPM, they are – on my opinion – not the primary business case for developing OCPM capabilities (as vendor or practitioner). You already know how to handle them sufficiently well. There may not be sufficient return on the investment needed to build OCPM capabilities for these processes. At least as long as the only objective is to just do what existing PM solutions do but now “the right way”.
Instead, we have to focus on use cases that are prohibitively expensive to do in a case-centric setting, either because it requires far too much custom logic and one-off analyses or because it requires seasoned experts with 10 years of experience to handle. What are these use cases? What are their characteristics? What exactly is costly and how will an OCPM-based approach lower the costs?
But I’d go even further and look at use cases and domains that were outright impossible to be addressed in a case-centric setting simply because all relevant insights cannot be captured in event sequences at all. Prime examples are all processes dealing with physical materials (material handling, manufacturing, logistics) where the actual objects being moved and combined matter.
We have seen substantial success in building OCPM ETL and analysis stacks for industrial use cases from zero in a span of 6-9 months in such use cases, for example

All these use case had in common that their application domain has
By their very nature none of these use case could exploit or re-use existing process mining algorithms because we were addressing questions that no existing algorithm could answer on data that no existing algorithm could consume. Everything had to be re-implemented. And each implementation was a one-off exercise. That is not a scalable model for developing standard process mining platforms to be customized, but we can make it a scalable model for letting data and problem owners develop their use-case specific process mining solutions: they have full access and knowledge of data and problem while a lot of “low hanging fruits” in OCPM do not require sophisticated algorithm engineering but succeed with good data modeling and querying using standard data bases. This was not a viable pathway to implement process mining in the case-centric setting 20 years ago, but could be a viable pathway in an object-centric setting with the currently available technology.
Doing so and documenting these as case studies would specifically provide the community with a trove of new process mining use cases and challenges for Object-Centric Process Mining.
Building an OCPM stack and approach changes the importance and boundary between the process mining analysis and the underlying data management solution (and the associated competencies to build and use it).
Classical event logs are a challenge for relational data management – as a case comprises multiple records – but rather suitable for classical algorithms which are good in iterating over sequences and collections.
Object-centric event data is a challenge for both: while the objects and relations are naturally represented in relational data models, event sequences per event and their ordering across events is not naturally modeled in relational data. While graph data models can capture this more naturally, the technology is not mainstream yet and is not (yet) as scalable as relational solutions. At the same time, process mining analyses still require iteration. This means we benefit from “moving process mining closer to the data” but we cannot fully move it to the data as the data system technology is not ready for it yet. And there are analysis steps that are always better done in dedicated algorithms. So we have to revisit the best practices and optimizations for dividing data modeling and analysis between database and algorithms that we built over the last 20 years. This will take time and detailed, careful research.
When replacing a case (or event sequence) with a graph of objects and events, previous process mining algorithms no longer apply while entirely new algorithms are needed to deal with and analyze dynamics in an interconnected setting. But these can only be developed at scale when use cases are clear.
Moving to OCPM also introduces new complexities:
All these technical challenges are prime research real estate and we can expect a lot of interesting research results in these (any many other) topics in the coming years. But solving them will not guarantee a smoother transition to OCPM.
Technologies and methods are adopted in society if they provide some form of benefit. In an industrial context, this benefit is often seen in specific, measurable value for the organization, for example through cost reduction, increased quality, increased productivity in the process itself or in the organization itself through improved well-being of workers or patients or reduced wear and tear of equipment. Value is highly context specific.
Process mining data models, algorithms, and dashboard do not generate value – regardless of whether they are case-centric or object-centric. Value is generated when the results of process mining can be used to realize a desired change in costs, quality, productivity, well-being, wear-and-tear, etc. Realizing value requires the organization (its people, machines, and systems) to perform the desired change.
That means object-centric process mining has to (better) interface with the organization to help it identify where change is needed and possible. We have figured out some answers to that question for the well-develop technology and methods stack of classical process mining. Specifically the area of simulation-driven process improvement where simulation models are learned from event data is mature with industrial platforms such as Apromore showing how to realize tangible insights for effective change.
But we hardly have a general answer that answers the question of how to effectively realize value (fast) with process mining – though it is gaining more research attention.
While I believe that OCPM has the potential to make the interfacing between process mining analysis and organizational (re)action more versatile – and as a consequence also easier to realize – OCPM will only succeed if research actually addresses the interfacing to the organization to realize value. A possible route has been described in the Manifesto for AI-Augmented BPM Systems.
Above, I touched on a lack of use-cases, techniques, and organizational embedding that hinder OCPM adoption in practice. I probably missed a lot of important aspects and details in each of them that have to be added – and will be added by the community over time.
Let me know what I have been missing.
But what I see as the one crucial hurdle is recognizing the interplay and dependencies between use case, techniques, and organizational embedding. Good use cases inspire good OCPM techniques, good OCPM techniques on relevant use cases will ease good organizational embedding. Expectations of good organizational embedding inspire good use cases. And it all requires good object-centric event data.
We will be faster in getting the full picture and make progress when practitioners, researchers, and vendors sit together at the same table. One way to make this happen is the ICPM Fellows Initiative which is organizing a first Online Session on OCPM to bring practitioners, researchers, and developers together.
I hope this overview inspires some of you to do so – reach out to researchers and pitch your case (pun intended).
Object-Centric Processes are a new way to look at processes: instead understanding a process execution as a sequence of isolated steps in a monolithic case, an object-centric process describes how its activities work on the various involved and related objects over time.
This idea of describing processes as emerging from an interplay of changes to related objects has been discussed and developed in the BPM and Process Mining research community for many years. It (finally) became visible to a broad audience at Celonis’ Celosphere 2022 event where Object-Centric Process Mining (OCPM) took center stage.
OCPM fundamentally changes the way we are able to think and reason about processes. While it gives a better grasp on the “true nature” of a process, we also have to relearn the very basics of processes, models, and event data.
To help the BPM and Process Mining community get familiar with the fundamentals ideas that drive OCPM, the organizers of the Objects A-Z workshop that the BPM Conference 2023 in Utrecht invited me to give a tutorial-style presentation on the concept and potential of object-centric processes.
After the workshop, I re-recorded my presentation so it is also accessible to everyone who could not attend.
The talk highlights the core thinking and concepts that underly object-centric processes and explain what makes them effective in analyzing complex real-world processes.
The talk points to ready-to-use Python libraries and public datasets and tutorials so that you can directly start doing research, development, and analysis in an object-centric approach.
If you rather want to browse the slides:
If you want to dive deeper into the topic, you can start following the Online Course: Multi-Dimensional Process Analysis.
The process mining landscape is evolving rapidly – both in industry and in research. But our education has not kept up. The “(still) very successful “original” Process Mining MOOC Process Mining in Action has been extremely successful in teaching the foundations of Process Mining to a broad audience of practitioners, students, and researchers aiming to get familiar with the field.
Since then, many new courses covering Process Mining have become available, both from vendors and the Covid-enabled video recordings of BPM and Process Mining courses uploaded to Youtube.
What is sorely missing in this landscape however is more structured education around the most recent, fundamental trends in process mining. At the Process Mining Summer School and at the BPM 2022 conference, I gave two lectures that summarized 10 years of research on Multi-Dimensional Process Analysis. The reactions were very positive and enthusiastic. At the same time, a 1.5 hour lecture is not a proper course. It lacks the exercises, tutorials, and longer timeline for learning, which we can offer to students enrolled in Master-level courses on Advanced Process Mining. Spurred by a comment on LinkedIn I chose to do something about this.
While this is an experiment, I think it is worth a try…
Taking the material I have collected and built over the last years, I have started building an Online Course: Multi-Dimensional Process Analysis. Starting today, I am gradually releasing “chapters” covering the following 12 topics in the coming weeks and months as time allows. (update 22-09-2023)
Each part comes with a video, open access literature, exercises and tutorials. It is aimed at (PhD) students, researchers from other fields, and specifically process mining professionals who want to learn more about one the most important developments in the process mining field.
This course is essentially a hypermedia online textbook. It does not require to enroll on any platform – but there is also no certificate for completing it, except for the knowledge you have gained in becoming a better process mining expert. Interested? Then head over to the course: it’s up and running.
This post summarizes my talk on “Data Storage vs Data Semantics for Object-Centric Event Data” I gave at the XES symposium at the ICPM 2022 conference.
I first provide a bit of background and the problem we faced, before I turn to the issue of separating data storage from data semantics.
Process Mining analysis starts when someone made event data available in a form that can be directly loaded into a process mining solution. Providing data suitable for analysis is a very labor-intensive process in itself, often taking the lion share of time until the first insights are obtained. Event data exchange formats are supposed to lower the hurdle by providing a common set of semantics concepts that all process analysis problem share.
The existing XES standard suffers from the limitation of pre-grouping events under a single case identifier, which makes it hard to use for analysis questions on many real-life systems. Aware of this problem, the process mining community has started a working group to develop a more versatile event log standard, currently called Object-Centric Event Data (OCED). A first intermediate result of this discussion is a meta-model that illustrates which key concepts we need to consider in data exchange.

The OCED meta-model tries to strike a careful balance between having a simple standard and adding more expressivity to event data exchange formats that includes:
Increasing the expressiveness of the data exchange format with concepts to describe how events operated over an entity-relational data model has an undesired consequence: the meta-model to describe all possible ways of how data can be operated on has to suddenly incorporate a large amount of semantic concepts. At the bare minimum, this is creating, reading, updating, deleting objects, attributes, and relations individually and together. At the same time, using just the bare minimum of concepts immediately reveals use cases that cannot be naturally expressed, asking for even more semantic concepts.
How to escape this dilemma was the topic of my talk, which I developed over many discussion with Marco Montali.
The fundamental point I am making is that the meta-model for data exchange in process mining has to separate the data storage from the data semantics.
Which problem are we solving with data exchange?

We want to help an analyst solve an analysis task for a real process. The analysis fundamentally is to understand the “ground truth” of the dynamics in the real world and to map it to an analysis artifact (digital image, shadow, twin, …) that is consistent with reality for the specific analysis task. A major complication in understanding processes operating on data is that these operations come at different levels of granularity:
Because inspecting reality is costly, we pass the data recorded by the underlying IT systems to process mining analysis tools which can reconstruct this digital image of reality. Again, that image has to be consistent with the ground truth of the real process to be of value.

The data exchange format has to allow this – no more, but also no less.
Unfortunately, the data storage in the underlying systems is optimized for usage: entities and objects are distributed over multiple tables, there are no events, just time-stamped records, relations can be expressed in many ways, activities are materialized in various forms. Moreover, data recording is “lossy” from the perspective of a historic analysis: certain data is never recorded or recorded incorrectly, other data is discarded when it’s no longer needed for operations.

As a consequence, the recorded data may (in parts) be inconsistent with the ground truth:
While these inconsistencies are ideally resolved by improving the data storage of the underlying IT systems, in reality most systems will store inconsistent data. As “consistency with the ground truth” is depending on the analysis task, it is impossible to fully resolve it when exporting the data into the data exchange format.
I therefore argue that the data exchange format should facilitate fast data exchange and rather write out data as-is (as it’s issues and problems are also known). A fundamental property of this data export must be
This doesn’t tell us yet how the exported data should be structured. For this, we should look at what we need to do with the data.
Even the most basic, classical process mining analysis already separates data semantics from data storage. Classical process mining starts from building a classical event log. The de-facto standard are CSV files where one column holds a timestamp and other columns essentially hold a number of attribute-value pairs. To turn this CSV file into an event log, the analyst has to pick one attribute that as case identifier and another attribute as activity.

And the analyst has to make this choice in line with the analysis task and what makes the data (more) consistent with the ground truth. This may require to combine multiple attributes to define the right case identifier to refine activities by using multiple attributes.
The space of choices simply becomes larger when we start including dynamics over data in the question.

We now have to make choices for how to model the dynamics of various entities (data objects, actors, equipment, …), relations, and attributes over various levels of granularity (from basic data operations via transactions to actions and entire processes). Each real-world process has its own, specific data structures. The analysis fundamentally has to reconstruct relevant aspects of these data structures (consistency with domain knowledge) in line with the analysis task. This requires flexibility during the import – specifically because different analyses may focus on different aspects.
This suggests that we should generalize the choice of activity and case identifier we do in the classical case to a description of how the recorded and provisioned data maps to the domain knowledge. This would provide the analyst with the design space to build their analysis.
We can create a separate semantic header that is separate from the raw exported data exported. This header has to how the stored data maps to the domain data model of the process.

The storage format for the raw exported data has at least to be:
On top of this, a domain export provides a semantic header that consists of
This semantic header is not tied to the specific data export. It can be provided beforehand, but also be revised and updated after data export as the analysis evolves or better domain information becomes available. This allows to gain more insights on previously exported data without having to re-export the data again.
To enable process mining over multiple objects, the semantic header has to to express at least which attributes and values describe objects, identifiers, the relevant relations between them – and which attributes belong to an object (are stored somewhere) and which attributes belong to an event (are just observations of a context that is not further stored). This is essentially what the OCED meta-model tries to achieve.
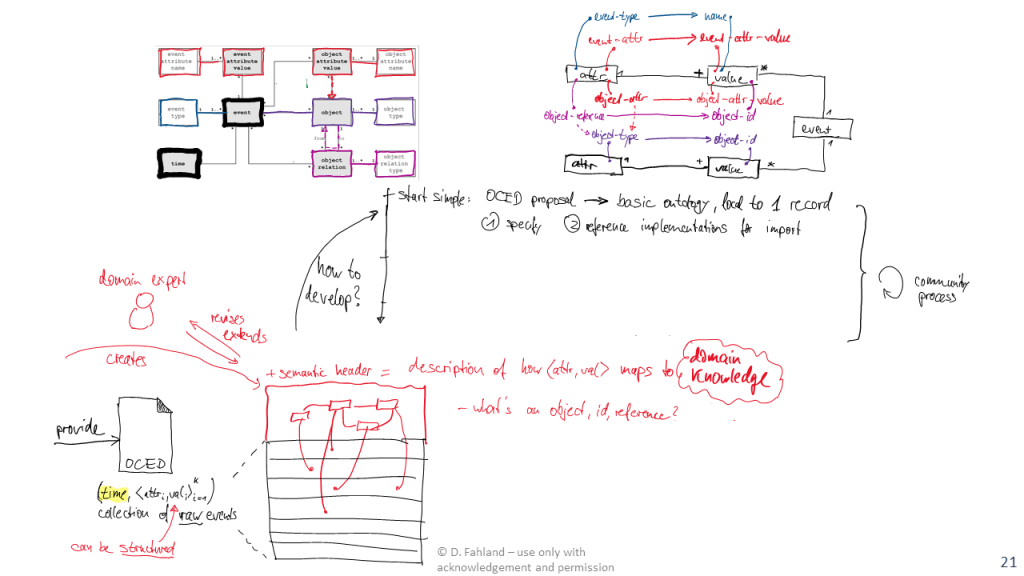
How could demonstrate the feasibility of this semantic header for solving this data exchange problem? The top-part of the above figure sketches how we could specify a mapping from attribute-value pairs of a raw data export to the basic concepts of the OCED meta-model:
This mapping only grounds the objects in the recorded data. We still need to map out the semantics of the operation on the data, which is represented in the OCED model as qualifiers of the relations between events and objects, attributes, and relations. This could for example be done by rules over the attributes such as: If event has type “Create Order” and refers to an object of type Order, then this object is created by the event.

While these semantic concepts can be grounded in a single event record, other concepts may need grounding in multiple event records, such as: which events together from a batch, which events belong to the same activity (start and end events), or which events modify a relation that was created previously.
Some of these process dynamics will be common among many processes, and also be stored using very similar or identical data structures. Others will differ strongly among processes and be represent very differently. By developing the key concepts for specifying semantic headers of process event data, we give an analyst the flexibility to specify the exact semantic model required for the specific process and analysis – without polluting the data storage format with the specifics of the process.
As a community, we have the obligation to help standardize semantic concepts of process that are shared by many processes. The OCED model is arguably the shared baseline. We should start here and create a few proof-of-concept implementations of semantic headers and functions for OCED that transform basic CSV (or OCEL) files into data analysis structures, specifically for object-centric process mining and event knowledge graphs.
Also this year, we are organizing the 3rd International workshop on Event Data and Behavioral Analytics (EdbA’22) at the ICPM’22. Part of our workshop philosophy is to dedicate half of the time to open discussions on the topics of the workshop. The discussion often turns to what makes the problems we are looking at difficult – and it’s usually hidden assumptions and under-researched topics. The second and third session on “Deviation Analysis” and “…beyond Control-Flow” surfaced the following topics (for which I managed to record a few short bullet points and questions).
See also The hidden assumptions and forgotten topics of Process Mining, part 1 (Human Behavior) for my notes on “Human Behavior”.
Typical structure in deviation analysis: first detect where did something happen we didn’t expect, then explain why this happened. Do we have to separate both steps or should they be combined/integrated?
How do we pick the right approach for detecting anomalies?
Adding more features to event data and analytics (data attributes/properties) makes the analysis more complex.
The common topic of these above questions is that our standard approaches lack concepts and data structures for modeling the context of a particular behavior that is outside the specific case. The two dimensions of Multi-Dimensional Process Thinking of the inner and the outer scope of a process (analysis) may help to think about these concepts and data structures by taking a different perspective on processes.
Also this year, we are organizing the 3rd International workshop on Event Data and Behavioral Analytics (EdbA’22) at the ICPM’22. Part of our workshop philosophy is to dedicate half of the time to open discussions on the topics of the workshop. The discussion often turns to what makes the problems we are looking at difficult – and it’s usually hidden assumptions and under-researched topics. The first session on “Human Behaviors” surfaced the following topics (for which I managed to record a few short bullet points and questions).

Classical event logs have the fundamental shortcoming of describing process behavior only in isolated process executions from the viewpoint of a single case entity. Most real-life processes involve multiple entities and process executions are not isolated but tightly connected – through actors and entities involved in multiple executions. This post summarizes how event graphs are a better model to describe and query such dynamics. I explain the basic ideas and how to construct a graph from an ordinary event table. By Dirk Fahland.
Classical event logs – the basis for all process mining – use a case identifier attribute to study the behavior in a trace: group all events with the same case identifier value and order them by time. We then can study the temporal ordering of process activities along the sequence of events to get insights into the process. The most basic temporal relation is the directly-follows relation: in a trace <e1,e2,e3,e4,e5,…> event e4 directly follows event e3.
But most real-life event data has more than one case identifier attribute. This forces to either leave out events or directly-follows relations or to squeeze events under a case identifier where they don’t really belong.
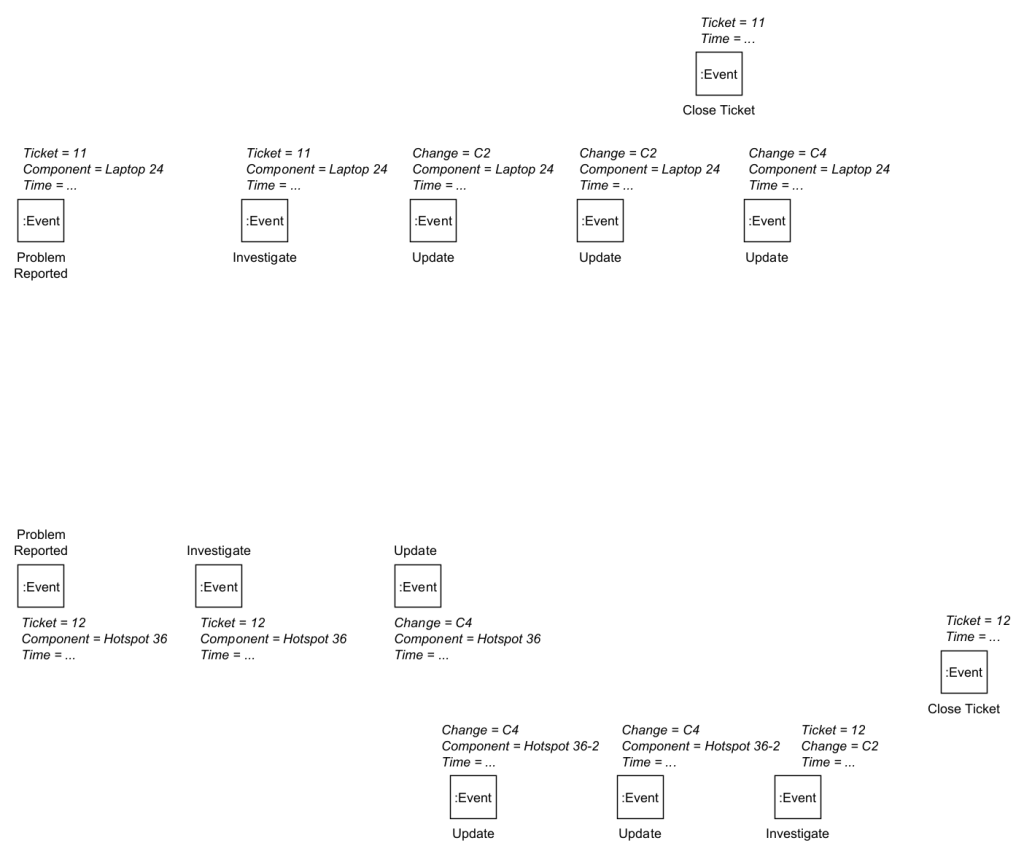
Consider the event table shown below. It has the standard event log attributes: action, time(stamp), but lacks a case identifier column that is defined for every event.

Most real-life event data is like this in their source system. The event data above most likely originates from three different tables
Creating a classical event log that contains all the events is impossible – unless one is willing to accept false information such as event duplication, or false directly-follows relations. For example, if we engineered a case identifier that separates events according to the horizontal line in the above table,
All this together makes it hard to answer the following question: Which problems preceded (possibly caused) the final Update on Laptop 24?
In the following, we explain how a graph-based structure based on the concept of Labeled Property Graphs allows to naturally describe this data. With the graph-based model, we can avoid introducing false information and better answer questions like the cause for the final update on Laptop 24.
A labeled property graph has nodes and edges (called relationships).
By using relationships between nodes in a graph, each Event can be correlated to multiple Entity node and each Event nodes can have multiple preceding and succeeding Event nodes (via DF) allowing model multiple DF-paths (one per entity).
Here is how you can construct such an event graph using these concepts.
Every event record in the input event table becomes an Event node. Every attribute of the event record becomes a property. We get the following graph of just Event nodes with properties.
In classical event log construction, we now would pick a unique case identifier column.
In event graph construction, we now identify which attributes refer to entities – and there can be multiple in the data. We pick the ones we are interested in.
This results in the following graph.

Note how most events are correlated to more than one entity.
In classical event logs, all events related to the same case identifier are ordered by time into a trace.
In an event graph, all events correlated to the same Entity node (via CORR edges) are ordered by time and we create a directly-follows DF edge between any two subsequent events. We store in the DF edge properties for which entity each DF edge holds. Doing this for the Entity node for Ticket = 11 results in the following graph.

We obtain a DF-path over three events from Problem Report via Investigate to Close Ticket. This DF-path states: “Entity Ticket=11 observed the sequence <Problem Report, Investigate, Close Ticket>”.
We have to do this for each Entity node for which we want to study behavior. The image below shows all resulting DF-paths over all events for all entities, but for readability we show only the CORR edge to the first event of a path.

Done. This graph fully describes the behavioral information contained in the original event table using local DF-relations per entity.
Looking at the DF-paths, we can directly see
The striking difference in complexity of paths for the three different component types can be explained by the very different nature of the entities.
We do see the different natures back in the way the different DF-paths synchronize in the graph.
There is more behavioral information that can be inferred in this graph, for example the dependency of Close Ticket for Ticket=12 on the final Update event of Laptop 24. Doing so requires to infer relationships between two Entity nodes and to materialize a relationship as a new derived Entity node, say between Ticket 12 and Laptop 24. We then can analyze the behavioral dependencies between two entities. How to do this is explained in this paper: https://doi.org/10.1007/s13740-021-00122-1
Event graphs based on labeled property graphs can be stored in a graph database system such as neo4j, which allows to query the graph using a graph query language.
For example, if we want to answer our earlier question “Which problems preceded (possibly caused) the final Update on Laptop 24?” we can write the following Cypher query
MATCH
(e1:Event {Action:”Problem Reported”})-[:DF*]->(e2:Event {Action:”Update”}),
(e1) -[:CORR]-> (t1:Entity {type:”Ticket”}),
(e1) -[:CORR]-> (c1:Entity {type:”Component”}),
(e2) -[:CORR]-> (c2:Entity {type:”Component”})

WHERE

NOT EXISTS (e2) -[:DF]-> (:Event)

RETURN e1,e2,t1,c1,c2
This query matches a DF-path from a Problem Reported event e1 to an Update event e2 where e2 may not have any subsequent event (there is no outgoing DF relationship). It returns e1,e2 and the ticket t1 and component c1 correlated to e1 and the component c2 related to e2.
Applied on our example graph, it will return two matches as highlighted below: e1 matches once with Problem Reported for Ticket 11 and once with Problem Reported for Ticket 12.
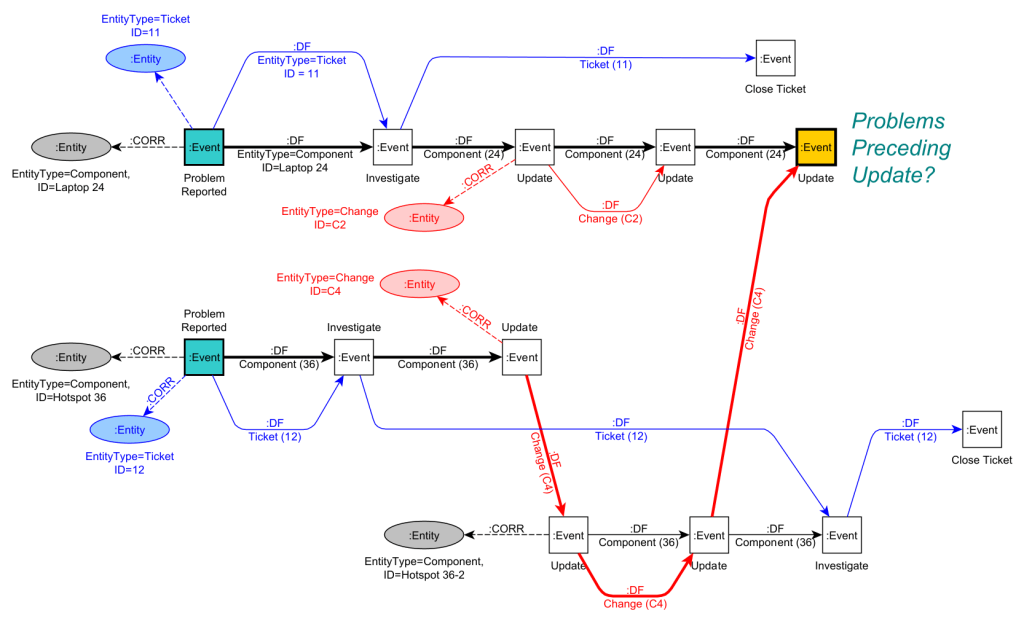
Note that the first matching path only uses DF-edges of one entity (Laptop 24) while the second matching path uses DF-edges of two different Entities (Change C4 and Component 36).
The above query is very limited: it works only for one specific Update event, it does not return the actual paths, and it does not collect the different results. All of these limitations can be overcome by extending the Cypher query.
The following open access paper https://doi.org/10.1007/s13740-021-00122-1
A complete implementation for importing 5 public event logs into event graphs is available here: https://doi.org/10.5281/zenodo.3865221
Here are 5 fully prepared event graphs from 5 different public event logs, both as Neo4j database dump and as GraphML file to import and analyze.
This paper uses event graphs to identify task patterns in processes by analyzing how DF-paths along cases and DF-paths along resources synchronize. https://doi.org/10.1007/978-3-030-85440-9_13
This paper uses event graphs to model and analyze patient care pathways with multi-morbid patients. https://arxiv.org/abs/2110.00291
Process Mining over multiple perspectives, dimensions, objects, entities, abstraction levels, etc. is gaining a lot of attention in the process mining field in 2021. If you want to learn more about the emerging topics in Multi… Process Mining, this short guide has you covered for the workshop day (1st Nov 2021) of the 3rd International Conference on Process Mining 2021 in Eindhoven https://icpmconference.org/2021/. By Dirk Fahland
I may have missed a talk. I made this overview is to the best of my understanding of the various announcements or prior knowledge on the presenters’ works. Let me know if I missed your talk that is also related to Multi… Process Mining.
ML4PM http://ml4pm2021.di.unimi.it, 1st Nov 09:00 – 10:15
Mahsa Pourbafrani, Shreya Kar, Wil van der Aalst and Sebastian Kaiser. Remaining Time Prediction for Processes with Inter-Case Dynamics, https://twitter.com/pads_rwth/status/1447848232986480640?s=21
Andrea Chiorrini, Claudia Diamantini, Alex Mircoli and Domenico Potena. Exploiting Instance Graphs and Graph Neural Networks for next activity prediction, https://iris.univpm.it/handle/11566/292094
PODS4H, https://pods4h.com, 1st Nov, 9:00-10:15
“Verifying Guideline Compliance in Clinical Treatment using Multi-Perspective Conformance Checking: a Case Study.” By Joscha Grüger, Tobias Geyer, Martin Kuhn, Ralph Bergmann and Stephan Alexander Braun.
ML4PM http://ml4pm2021.di.unimi.it, 1st Nov 11:00 – 12:15
Mahmoud Shoush and Marlon Dumas. Prescriptive Process Monitoring Under Resource Constraints: A Causal Inference Approach, https://arxiv.org/pdf/2109.02894v1.pdf
EdbA http://edba.science/program/, 1st Nov, 11:00-12:15
Tobias Brockhoff, Merih Seran Uysal, Isabelle Terrier, Heiko Göhner and Wil van der Aalst. Analyzing Multi-level BOM-structured Event Data.
SA4PM https://sa4pm.win.tue.nl/2021/program/ 11:00-11:25
PErrCas: Process Error Cascade Mining in Trace Streams, Anna Wimbauer, Florian Richter, and Thomas Seidl, https://sa4pm.win.tue.nl/2021/wp-content/uploads/sites/3/2021/10/ICPM2021_paper_150.pdf
PODS4H, https://pods4h.com, 1st Nov, 11:00-12:15
“Discovering care pathways for multi-morbid patients using event graphs.” By Milad Naeimaei Aali, Felix Mannhardt and Pieter Jelle Toussaint. https://twitter.com/milad_n_a/status/1446112238759153664?s=21
PQMI2021, http://processquerying.com/pqmi2021/, 1st Nov, 14:00-15:00
Celonis PQL: A Query Language for Process Mining, Jessica Ambros
PQMI2021, http://processquerying.com/pqmi2021/, 1st Nov, 15:45-16:05
An Event Data Extraction Approach from SAP ERP for Process Mining, Alessandro Berti, Gyunam Park, Majid Rafiei and Wil van der Aalst, https://twitter.com/pads_rwth/status/1447552080831471626?s=21
EdbA http://edba.science/program/, 1st Nov, 15:45 – 17:15
Plenary Workshop Discussion on behavioral analytics and event data beyond classical event logs.
The only problem with this fully packed workshop program is: it’s impossible to follow all talks as a single person.
There is a lot more on Multi… Process Mining coming on the other days of the conference https://icpmconference.org/2021/events/ in research, tool demos, the industry day l, the XES 2.0 workshop, and at the vendor booths.
By Dirk Fahland.
Here is a list of activites by the Process Mining vendors at ICPM that I have seen in the program that – in my view – will have a relation or show use cases for Multi… Process Mining.
It seems that Thursday 9th October 12:30-14:00 is high-noon for Multi…Process Mining of the process mining vendors at ICPM.
I may have missed some relevant events – if I did, let me know in the comments.
