The previous Part 4 showed the Convergence and Divergence problem. In essence: grouping events from multiple different objects into the same trace falsifies the information in the data. Applying process mining on such false data leads to false results and insights.
The consequence is that we have to re-think process mining techniques from the ground up as every tool and technique we applied so far either no longer applies or needs serious reconsideration. The techniques and methods that come with this are so fundamentally different that they require a distinct name: object-centric process mining. This and the next parts are all about this paradigm. And we have to start by discussing the data models that can correctly model events over multiple objects/entities without convergence and divergences.
This part introduces not only a different data model to correctly model the behavioral information over multiple data objects, but also an easily accessible technology stack to build your first own object-centric process mining analysis.
- Data Models for Event Data – a short review
- Event Knowledge Graphs: A graph-based data model for events and entities
- Hands-On: Build your own object-centric process mining analysis using the neo4j graph database
- Industrial Case Studies with Event Knowledge Graphs
- Further Tutorials, Data, Tools
Data Models for Event Data – a short review
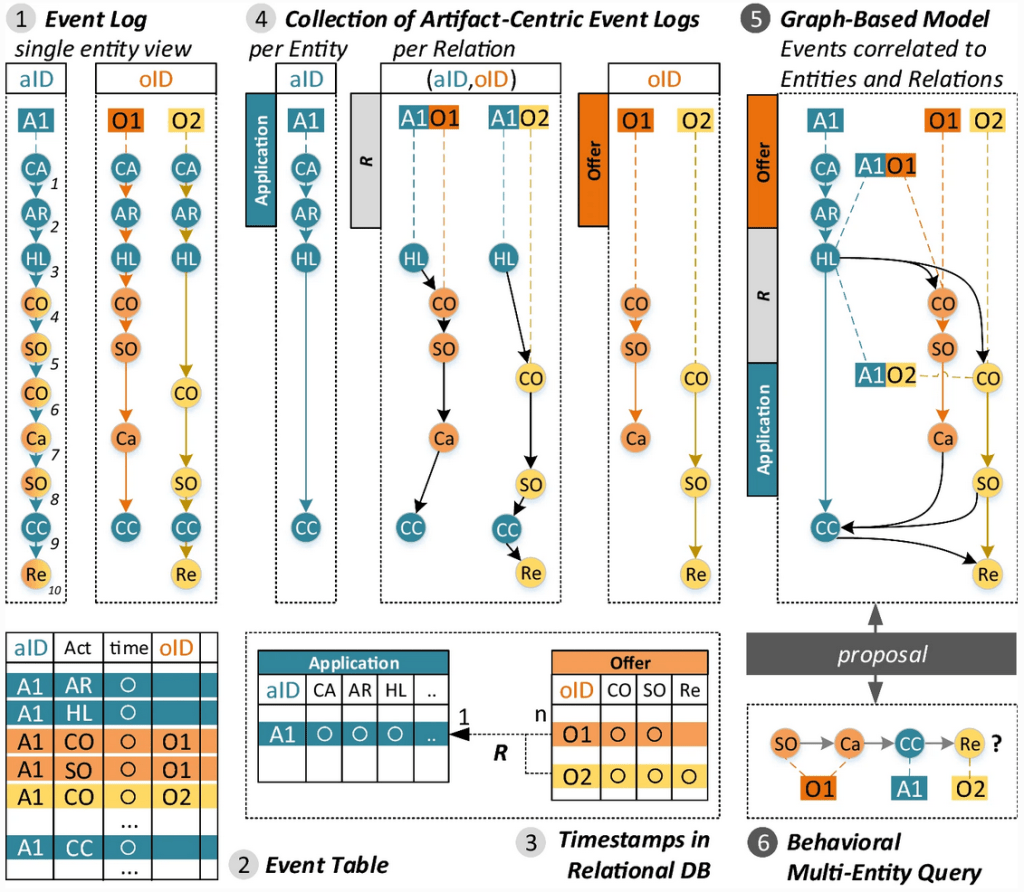
The problems of convergence and divergence originate from flattening and denormalizing the relations between different entities into a flat event log of global sequences. The fundamental idea to prevent this problem is to not construct a single sequential trace for the entire process execution. Instead, we construct for each data object its own individual trace.
This idea of separating event data per data object has been studied extensively for at least 12 years, likely longer, leading to multiple proposals for various data models.
- Read the “Background” section of the open access article “Multi-Dimensional Event Data in Graph Databases“.
This Background section covers
- fundamental data features that have to be recorded in any event data format to enable process analysis,
- requirements for data models for event data that enable analysis over multiple data objects and while avoiding convergence and divergence (based on an extensive literature analysis)
- a review of existing data models (from event tables with multiple identifiers to triple stores)
The fundamental idea of all effective data models for events over multiple objects is to either explicitly store one trace per object or to provide data operations to construct traces per object as needed. The traces of the different objects meet or synchronize in shared events – for example those that update two different objects. This idea can be expressed and implemented in various forms and data models.
Exercise: extracting traces per object
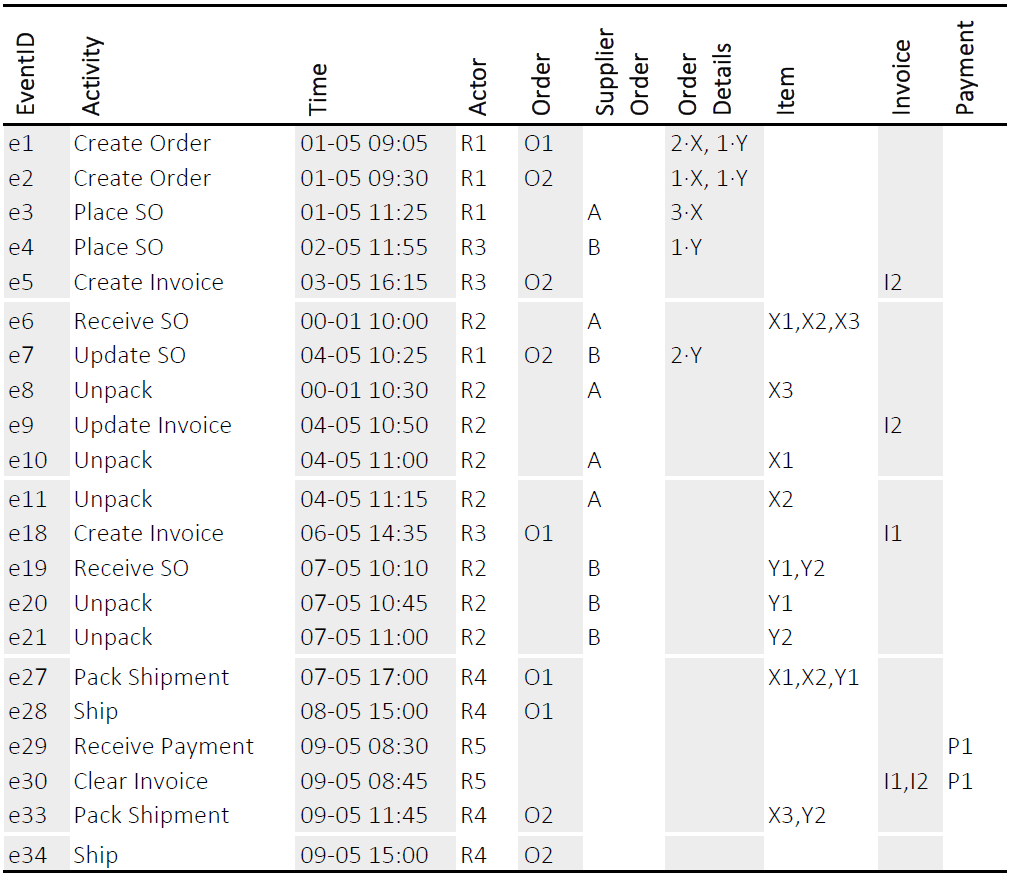
Extract the object-traces for each of the objects in the running example of the Order Process introduced in Part 4 – Convergence and Divergence.
- Download the event table (Excel format) of the order process: example_order_process_event_table_orderhandling.xlsx
- Open the file in a Spreadsheet program.
- For each object type (Order, Supplier order, Item, Invoice, Payment)…
- … and for each object identifer per type (O1, O2) then (A,B) etc …
- filter the table to only show the event records containing the object identifier (e.g., all rows where O1 occurs, all rows where X1 occurs alone or with other values)
- each filtered-down table is the trace for one object.
In terms of relational databases, this is a selection operation on the rows related to one objects. In terms of event logs (where we consider sequences of events), this is a projection operation on the elements of the sequence related to the same object.
Notice that through this filtering, we avoid divergence as each object-trace only contains the events related to this very object and no events of unrelated objects appear. But we are still creating multiple copies of events that are related to multiple objects. For example, e7 occurs in the object-trace of O2 and of B. In reality, both O2 and B synchronize in this shared events e7.
To also avoid convergence, we have to use a data model that contains each event only once and can express that this event is part of two different traces.
In the following, we discuss a graph-based data model. Graphs are a natural data model for such structures. By materializing the event data and the object-traces in a graph form, we also avoid the need to repeatedly filtering the source data to obtain the object traces. At the end of this part, we point to various other ideas and implementations of object-centric process mining.
Event Knowledge Graphs: A graph-based data model for events and entities
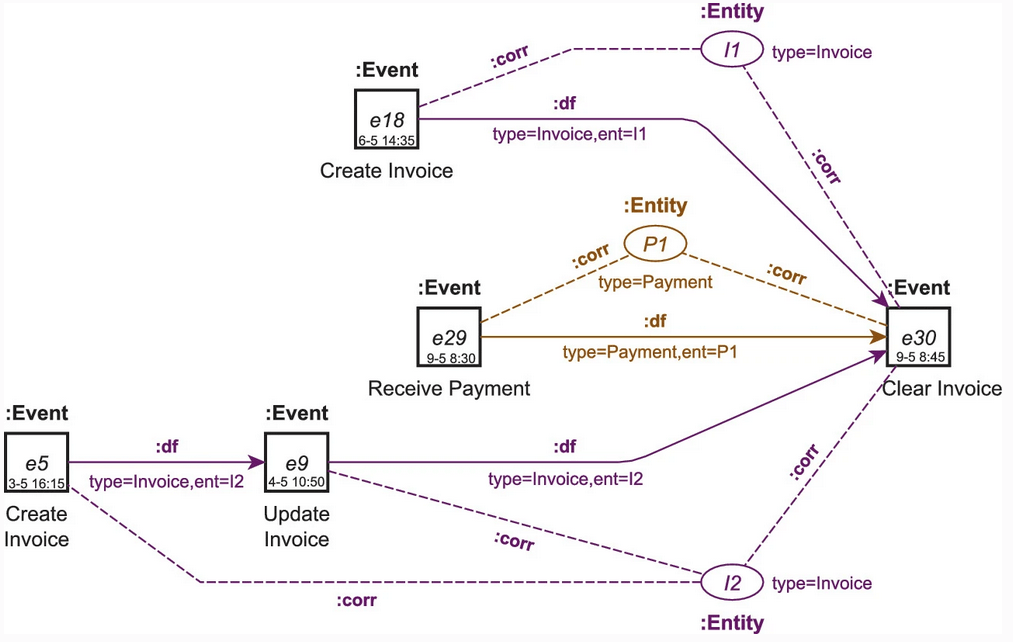
Technically, we turn to a particular form of knowledge graphs (labeled property graphs). We show how to use knowledge graph concepts to
- naturally model that one event is related to (or operates on) multiple different data objects – resulting in a network of events and objects
- naturally model for trace of each object as a path of events in the graph – resulting in a network of event paths.
Another benefit is that knowledge graph technology has been researched and developed extensively and we can rely on established data stores and tooling.
Regardless of the specific technical flavor (specifically labeled property graphs, knowledge graphs, or graph-based data models at all), using this (or similar) data models is the fundamental prerequisite and enabler for Object-Centric Process Mining. The following video introduces the idea of event knowledge graphs on our running example.
Reading: definition and construction of Event Knowledge Graphs
Read the Section “Event Knowledge Graphs” of the open access Process Mining Handbook to understand the concepts explained in the video, specifically:
- Labeled Propety Graphs
- the node and edge types of Event Knowledge Graphs
- the steps for constructing an Event Knowledge Graph from an event table
- directly-follows paths in event knowledge graphs.
Exercise: your first event knowledge graph
The video shows the steps of constructing an event knowledge graph on a small example. To get fully familiar with the concept
- Download the full event table of the example shown in the video.
- Take a sheet of paper and construct the full event knowledge graph by hand, following the steps shown in the video and explained in the reading material.
Exercise for Process Mining Professionals: your first event knowledge graph for ERP System data

Consider the simplified ERP system data in the tables on the left. Can you adapt the steps for event knowledge graph construction to this example? Some hints:
- First transform the relational data into event tables. But instead of creating one global event table under a single case identifier, create multiple object-type specific event tables, e.g. one for Sales Orders, one for Return Orders, etc.
- Then “import” the events from all tables.
- Then continue with inferring entities.
Can this be done differently? Faster?
Hands-On: Build your own object-centric process mining analysis using the neo4j graph database
Event Knowledge Graphs use Labeled Property Graphs as their underlying generic data model. This data model in turns is supported by a variety of graph database systems. One of them is Neo4j which is freely available for private use and developers. This makes this platform a good starting ground for getting familiar with event knowledge graphs and doing your first object-centric process mining analysis
- Follow and complete the Tutorial for building your first event knowledge graph with Neo4j and Cypher – for the example discussed in the video.
Analysis through querying

Having built the event knowledge graph, your next step is to query it for analysis. Here are some possible analysis tasks for the data. Formulate the Cypher corresponding cypher queries to answer them:
- All events related to Order O1
- All events related to Order O2 and a Supplier Order
- All events where at least two Item entities are involved.
- The Item which had the shortest time between Unpack and Pack Shipment
- Which object had the longest overall waiting time between any two subsequent steps? What was this waiting time?
- Supplier Order had 3 subsequent Unpack events for 3 different Items
- Which events of which objects precede each Pack Shipment events?
- Which events followed Update SO? Which objects were affected by it?
Which other kinds of analysis questions can you think of?
New performance measures
Once we are in an object-centric “world”, other performance analysis questions arise. Traditionally, we measure waiting time and soujourn time. For steps where multiple objects synchronize in the same event, such as batching in the Pack Shipment activities, new performance measures are needed. The following paper defines such new measures:
- Park, G., Adams, J.N., van der Aalst, W.M.P. OPerA: Object-Centric Performance Analysis. ER 2022. open access version available here: https://arxiv.org/abs/2204.10662
Study Figure 2 of this paper and answer the following question for the example using Neo4j/Cypher
- What is the minimum, average, maximum waiting time for Pack Shipment?
- What is the minimum, average, maximum pooling time for Pack Shipment?
- What is the minimum, average, maximum lagging time for Pack Shipment?
- What is the minimum, average, maximum synchronization time for Pack Shipment?
- What is the minimum, average, maximum flow time for Pack Shipment?
More queries
This part of the course is still under development. More material will be added in the future. In the meantime, here are some pointers
- Python scripts for automating event data import and graph construction:
- https://github.com/multi-dimensional-process-mining/graphdb-eventlogs provides Python scripts implementing parameterized Cypher query templates for building event knowledge graphs of 5 real-life event logs using Neo4j, see also https://zenodo.org/record/4708117 for a fully packaged
.zipwith queries and datasets - The section Querying Multi-Dimensional Event Data of the open-access paper Multi-Dimensional Event Data in Graph Databases presents several types of queries on the event knowledge graph of the BPI Challenge 2017 event data (scripts to construct BPIC17 graph)
Object-centric process discovery
A later part will cover object-centric process discovery in more detail. But if you are interested, here are two tutorials for how to perform object-centric process discovery by simple aggregation in graph databases: multi-object process maps and proclet models
Industrial Case Studies with Event Knowledge Graphs
Although the concept of event knowledge graphs is rather young, they have already been applied succesfully in industrial case studies (all open access):
- Milad Naeimaei Aali, Felix Mannhardt, Pieter Jelle Toussaint: Discovering Care Pathways for Multi-morbid Patients Using Event Graphs. ICPM Workshops 2021: 352-364
- Chu, V. Using. Event Knowledge Graphs to Model Multi-Dimensional Dynamics in a Baggage Handling System. Master thesis. Eindhoven University of Technology. 2022
- Swevels, A. J. E. Creating a Digital Shadow of a Manufacturing Process with Inferred Missing Information using an Event Knowledge Graph Master thesis. Eindhoven University of Technology. 2022
Further Tutorials, Data, Tools
The field of object-centric process mining is just emerging. Many other tools and ideas are being developed. Explore them to get familiar with the field:
- Object-Centric Proces Mining: https://www.ocpm.info/ (object-centric process mining, conformance checking, advanced statistics)
- Object-Centric Process Insights: https://ocpi.ai/ (object-centric process discovery, object-centric trace variants visualization)
- Object-Centric Performance Analysis: https://github.com/gyunamister/OPerA
| < Part 4 – Convergence and Divergence | Part 6 > |
