The performance spectrum reveals patterns in the data describing how multiple cases together are synchronized, form a load peak, or a local, dynamic bottleneck. Interestingly, these emergent dynamics also propagate to other parts of the process over time.
This part explains current research and developments on how to detect performance patterns and propagation automatically and for which use cases detecting these patterns is useful. We explore two concrete types of patterns and use cases:
- Detecting emergent system-level events that capture when multiple cases together show an usual or deviating performance characteristics, such as load peaks or local dynamic bottlenecks, and detecting how they cascade to other parts of the process – possibly having negative impact on other, unrelated cases.
- Detecting batching dynamics when multiple unrelated cases are processed together, benchmark processes regarding batching, and how to improve process prediction by engineering features based on batching.
- Use Case: Understanding causes of bottlenecks
- Reflection: System-level dynamics
- Detecting Emergent System-Level Events
- Reflection: System-Level Events
- Detecting Cascades
- Case Study: Cascades in a Real-Life Baggage Handling Systems
- Reflection: Cascades
- Further Development of Cascade Detection
- Batch Detection and Usage for Prediction
Note: The techniques and tools are still under active research and development. As a result, this part has less hands-on elements – for now. As easier to use tools will become available in the coming months, this part will be updated.
Use Case: Understanding causes of bottlenecks
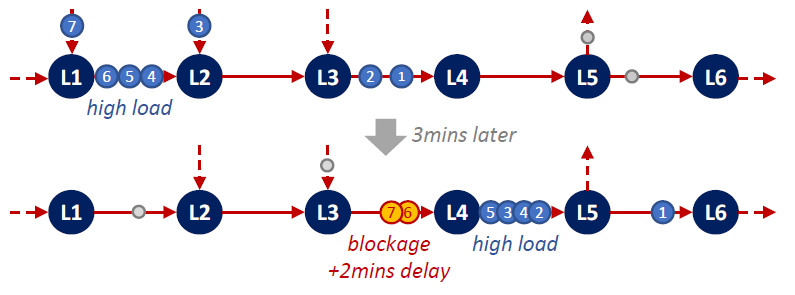
The diagram on the left illustrates a baggage handling system at an airport where bags are moving along conveyor belts (arrows) to processing steps (nodes).
The joint arrival of bags 4,5,6 causes a higher load of cases (bags) between L1 and L2. This load can still
be processed normally with additional bags 3 and 7 about to enter. This high load propagates forward via conveyor belts to L2, L3, L4. Between L4 and L5 bags 2, 4, 3, 5 saturate the physical system capacity: no more bag fits the belt from L4 to L5. Thus processing at L4 is temporarily slowed down by stopping the conveyor belt from L3 to L4, causes 6 and 7 to blocked for 2 minutes.
Such dynamics are common in physical processing system. The high load between L4 and L5 due to bags 2, 4, 3, 5 causes the bags 6 and 7 to be delayed. Below we discuss how to detect and describe such phenomena: by detecting emergent system-level events and correlating them into cascades.
Reflection: System-level dynamics
Revisit the list of processes you noted down in Part 1 – What are Processes?.
- Think for each of the processes of a system-level dynamic that may arise in it. Have you observed them in the real world? How do they manifest?
- What is the reason this system-level dynamic emerges?
- What are the consequences of it for the process?
Detecting Emergent System-Level Events
The basic idea for detecting emergent system-level events is simple. The input to the technique is a classical event log with case ID, activity name, and case identifier.
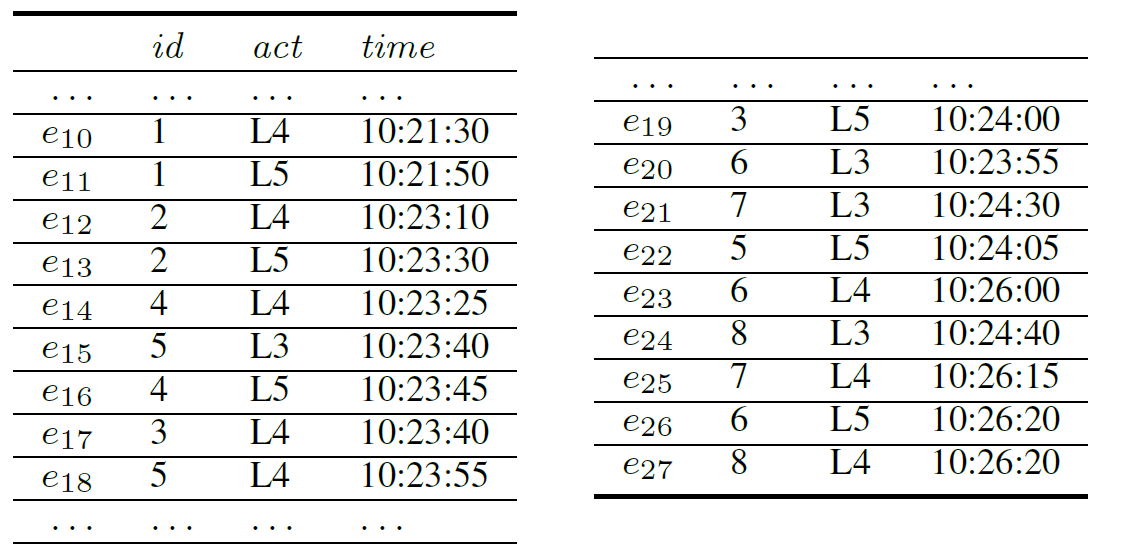
The event log on the left hand side shows an example of events tracking bags in a Baggage Handling System. Each bag has a unique identifier defining the case of the bag as it travels through the system.
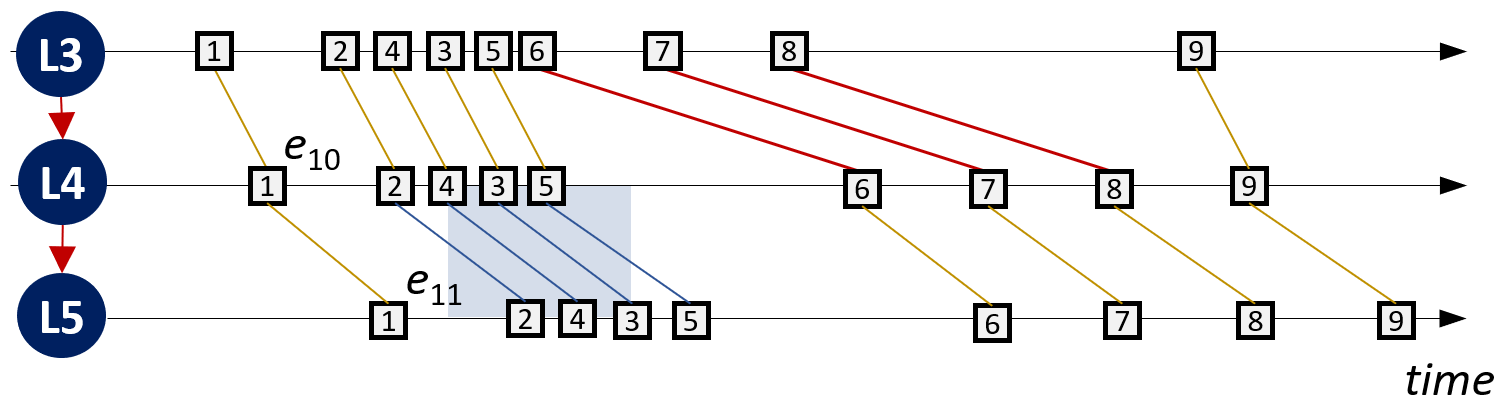
The figure on the left visualizes the performance spectrum for our input event log (and some more events). The figure highlights two performance patterns of interest:
- the cases 6,7,8 are in a bottleneck between L3 and L4
- the cases 2,3,4,5 together form an above average load between L4 and L5
The patterns are visible to our eyes. We now want to turn them into features for analysis. This requires five steps:
First, we have to make the lines in the performance spectrum a feature. For every pair (e1,e2) of directly following events in a case we create an “interval event”.

The table on the left shows the interval events we can compute from the input event table. For example,
- events e10 and e11 are grouped into the interval event s72,
- events e14 and e16 are grouped into the interval event s74
- etc.
Each interval event has a source and a target activity, and start and an end timestamp (coming from the two events that form the interval event).
Second, we group all interval events by their (source,target) activity pair and order them by their start time. Technically, this can be as a new event log where the (source,target) pair is the case identifer. In our example, we group the interval events as follows:
- (L3,L4): s75, s78, s79, s80
- (L4,L5): s72, s73, s74, s76, s77, s81
Third, we choose Key Performance Indicators (KPIs) for which we want to detect performance outliers. In our example:
- soujourn time or travel time of a bag from one activity to the next, which we can measure as the different start-end of an interval event
- load in a segment, which we can measure as the number of bags on a segment per minute
Four, we define for each KPI a threshold by which a KPI value is flagged as outlier. The threshold is always dependent on the process, the domain, and the characteristics of the data and requires careful data analysis and validation with users and stakeholders.
In our example, the threshold for soujourn time is defined by the modified z-score, i.e., if the deviation of the soujourn time from the mean is much higher than the median of all deviations. In our example, the soujourn times for s78, s79, s80 (bags 6, 7, and 8) deviate much more from the mean soujourn time than all other bags.
The threshold for load is defined as the 75%ile of cases/minute. The highlighted time window has a load of 4 bags/minute (s73, s74, s76, s77 for bags 2,4,3,5) while all other time windows have a lot of 1-2 bags/minute.
Five, we construct system-level events from groups of interval events. Every set of consecutive interval events that exceed the threshold for a KPI are grouped into a system-level event.
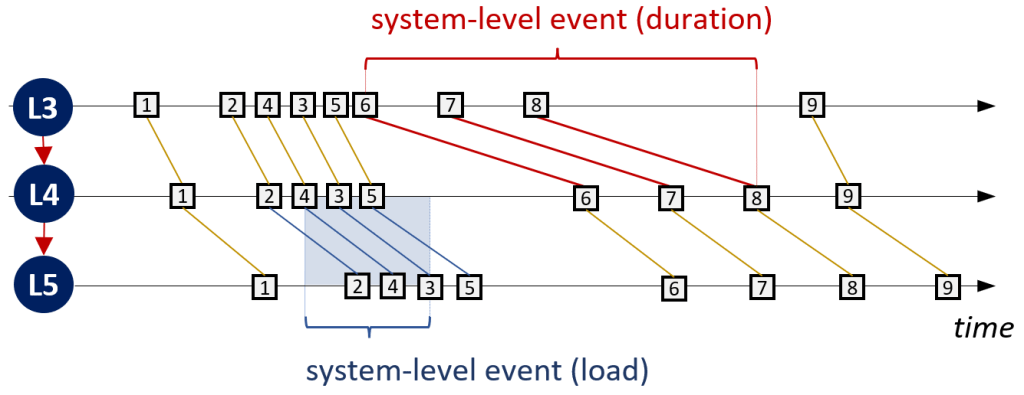
In our example,
- the interval events s78, s79, s80 are grouped into a system-level event of type “longer duration” or “blockage”
- the interval events s73, s74, s76, s77 are grouped into a system-level event of type “high load”

This results in a system-level event log where each system level event has a set of underling interval events (sev in the table on the right), a start and end time (based on the first start and the last end time of the underlying events), a source and target activity (from the segment where all interval events occurred) and a type. In our example
- s78, s79, s80 are grouped into system-level event h5 of type BL (blockage)
- s73, s74, s76, s77 are grouped into system-level event h4 of type HL (high load)
The table shows more system-level events (not derived from the input table above). We will use them in a moment.
Reflection: System-Level Events
Revisit the list of processes you noted down in Part 1 – What are Processes?.
- Which kinds of system-level events would be interesting to detect?
- Which KPI should be used to detect it?
- Which thresholds should be chosen to detect only the “interesting” events?
Detecting Cascades
The system level events in our system-level event log are observations “above” the case level. While they are grounded in underlying case dynamics, the system-level events themselves are not tied one case. However, the different system-level events may be correlated to each other. In the case of a baggage handling system, just like in a road traffic, cases cannot move forward arbitrarily: they rely on physiscal space or processing space to move forward. If three bags or cars congest a particular area, no other bags or cars can move through it. Further bags and cars also have to stop, but in a different area, and so on.
We can use heuristics to correlate system-level dyamics that are likely influencing each other. A basic heuristics is, two system-level events h1 and h2 are correlated if
- h1 and h2 overlap in time (i.e., their time intervals defined by start and end time overlap)
- h1 and h2 overlap in space (i.e., their source and/or target activities overlap)
For example, in the system-level event log above, h4 and h5 overlap in time (10:23-10:24 and 10:23-10:26) and in space (L4). System-level events h5 and h6 overlap in time but not in space.

Applying the above heuristics to all system-level events results in the correlations shown on the left: each system-level event is drawn as a node. We can give the correlation a direction based on the timestamps of the system-level events: the edge goes from the system-level event starting/ending earlier to the system-level event starting/ending later.
A connected graph of system-level events connected in this way is a cascade.

The cascade materializes in a graph the dynamics we described in the beginning: a group of bags causes high load between L1 and L2; this high load propagates forward “downstream” to (L4,L5) and then to (L5,L6). But the load at (L4,L5) is also follwoed by a blockage “upstream”.
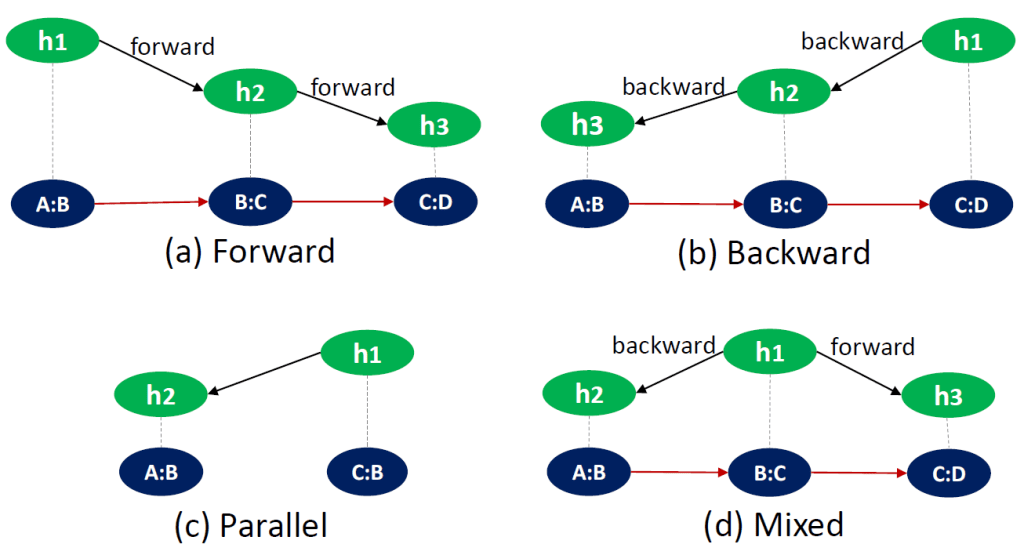
Thus, the propgation of system-level behavior in cascades can be classified into
- forward propagation – the system-level dynamics moves in the direction of the process
- backward propagation – the system-level dynamics moves in the opposite direction of the process: cases which were not part of the original dynamics get caught in it (e.g., a traffic jam)
- parallel propagation – the system-level dynamics originates from two different sources in the system (e.g., A and C) but reaches the same destination (e.g., B), or conversely propagates from a single source into multiple affected areas.
- mixed – when the system-level dynamic propagates both forward and backwards.
Case Study: Cascades in a Real-Life Baggage Handling Systems
Applying the above ideas on event data of a real-life baggage handling system allows to detect various cascades as illustrated below.
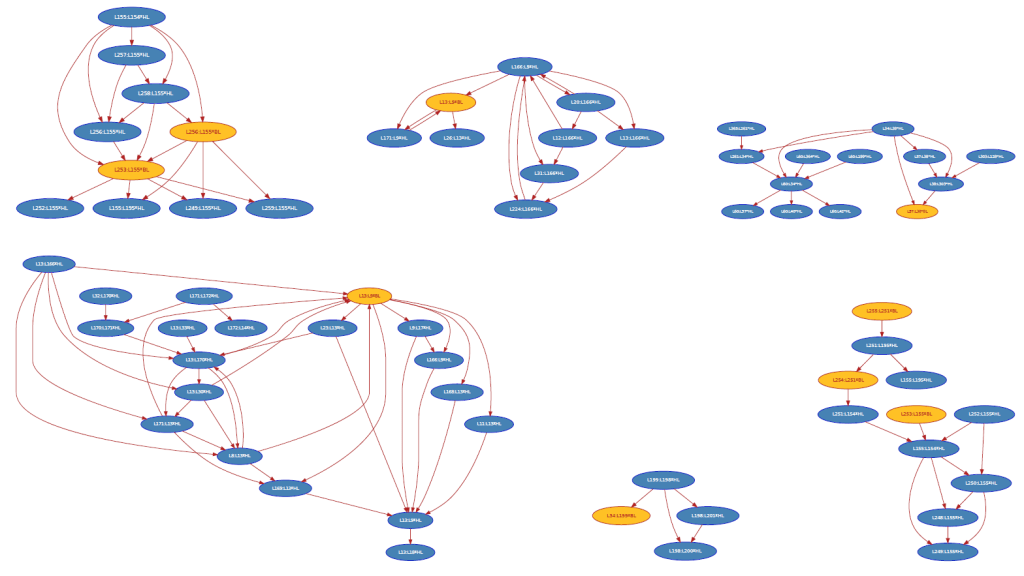

More details of this case study are available in
- Zahra Toosinezhad, Dirk Fahland, Özge Köroglu, Wil M. P. van der Aalst: Detecting System-Level Behavior Leading To Dynamic Bottlenecks. ICPM 2020: 17-24
- Mandemakers, M. J. J. Analyzing Causes of Outlier Cascade Behavior in Baggage Handling Systems. Master Thesis Eindhoven University of Technology.
Reflection: Cascades
Revisit your notes on system-level behaviors and system-level events you made above. Pick one process you noted down in Part 1 – What are Processes? and do the following:
- Take a sheet of paper.
- Sketch (a part of) the process, i.e., the process model/map/diagram showing the sequence of steps, where a relevant system-level dynamic may arise.
- Sketch 1 or 2 cascades that may occur in this process. How would the underlying event data look like that could cause these cascades?
Further Development of Cascade Detection
The following paper(s) are developing the concepts and techniques for detecting system-level behavior and cascades further to make them applicable for a wider range of processes and problems.
- Bianka Bakullari, Wil M. P. van der Aalst: High-Level Event Mining: A Framework. CoRR abs/2211.00006 (2022) (open access)
Batch Detection and Usage for Prediction
Note: this part is still under development. Updates will be released at later time.
The following literature provides further information on detecting batching and using the features for prediction.
- Luise Pufahl, Niels Martin: Batching vs. Non-batching in Business Processes. EMISA 2018: 41-45 (open access)
- Eva L. Klijn, Dirk Fahland: Performance Mining for Batch Processing Using the Performance Spectrum. Business Process Management Workshops 2019: 172-185
- Eva L. Klijn, Dirk Fahland: Identifying and Reducing Errors in Remaining Time Prediction due to Inter-Case Dynamics. ICPM 2020: 25-32
- Niels Martin, Luise Pufahl, Felix Mannhardt: Detection of batch activities from event logs. Inf. Syst. 95: 101642 (2021)
- Niels Martin, Andreas Solti, Jan Mendling, Benoît Depaire, An Caris: Mining Batch Activation Rules from Event Logs. IEEE Trans. Serv. Comput. 14(6): 1837-1848 (2021)
